
A simple NFL betting model is a spreadsheet that turns each team's scoring averages into a projected score, turns that score into your own spread and total, and compares both to the sportsbook's line. You bet only when the gap between your number and theirs is big enough to matter. Every other game is a pass.
You do not need to code and you do not need paid data. The whole thing runs in Google Sheets on free stats, and once it is built, updating it takes about five minutes a week.
Below is the full build, step by step, with the formulas and the rules that keep a simple model from fooling you.
Why build a model in a spreadsheet at all?
I first built probability models in Excel at university, for water science, not for sport. That is what changed how I bet.
Before, I talked about games the way most bettors do: "they're playing well," "they need this one." After, I had a number: "I estimate 58%, the book implies 52%, the gap is big enough." A spreadsheet forces you to stop telling betting stories, because a cell only accepts numbers.
I have never met a successful bettor who could not use a spreadsheet. Your model does not have to be clever. It has to make your opinion visible, so you can check it against the price before the game and against the result after it.
What data do you need, and where do you get it for free?
For the simplest version, two numbers per team:
- Points scored per game
- Points allowed per game
Pro Football Reference and ESPN both publish these for free. Copy the team table, paste it into a tab called Data, and let every other tab read from there. My own NFL sheet runs on free stats from those two sites, and the weekly copy and paste takes about ten seconds per table.
Keep last season's numbers in a second tab. You will need them in September.
How do you turn team stats into a projected score?
Average what one team scores with what the other team allows, then add home field.
- Home team: (home points scored + away points allowed) / 2, plus half of home field advantage
- Away team: (away points scored + home points allowed) / 2, minus half of home field advantage
Home field used to be worth about 3 points in the NFL. Most modelers now use less than that, and 2 points is a sensible place to start.
Here is an example with two made-up teams:
| Team | Points scored per game | Points allowed per game |
|---|---|---|
| Home team | 24.0 | 20.0 |
| Away team | 21.0 | 23.0 |
With home field at 2 points:
- Home: (24.0 + 23.0) / 2 + 1.0 = 24.5
- Away: (21.0 + 20.0) / 2 - 1.0 = 19.5
Projected score: 24.5 to 19.5. That makes your spread home -5.0 and your total 44.0.
In Google Sheets, with the table above in columns A to C, the home formula is =(B2+C3)/2+1 and the away formula is =(B3+C2)/2-1. For a full week, give each game its own row, pull each team's two numbers in from the Data tab with a lookup, and copy the same two formulas down.
How do you compare your number to the sportsbook's line?
Put the book's spread and total next to yours and subtract.
| Market | Your number | Sportsbook | Gap |
|---|---|---|---|
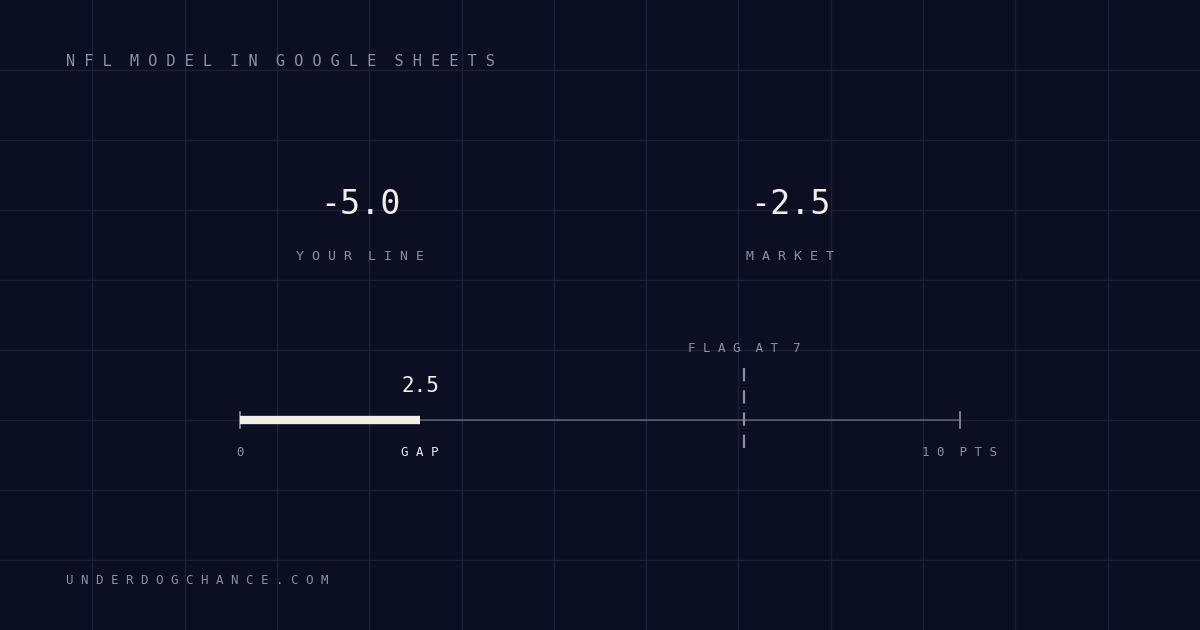
| Spread | Home -5.0 | Home -2.5 | 2.5 points |
| Total | 44.0 | 47.5 | 3.5 points (under) |
Your sheet says the home team should be a bigger favorite than the book thinks, and that the game should score less.
You can also turn the gap into a probability, which is how you actually price a bet. NFL final margins land around the expected margin with a standard deviation of about 13.5 points, the figure most modelers work with. So in Google Sheets:
=1-NORM.DIST(2.5, 5, 13.5, TRUE)
That returns 0.57: a 57% chance the home team wins by more than 2.5. At -110 (1.91 in decimal odds) you need 52.4% to break even.
On paper, that is value. It is not a bet yet, and the next section is why.
How big does the gap need to be before you bet?
Bigger than most people expect. A simple model has its own error. Averages over a few games swing a lot, and the sheet knows nothing about injuries, weather or a backup quarterback. A 2.5-point gap sits well inside that error, so the 57% above is not as solid as it looks.
That is why my NFL sheet only flags a game by default when its number and the bookmaker's line are 7 points or more apart. Most weeks, most games are a pass. That is the model doing its job.
When a game does get flagged, the first question is what the model does not know. A gap that big is usually news the market already has: a quarterback ruled out, a key injury, a bad forecast. Check it. If nothing explains the gap, that game has earned a closer look.
How do you use the model in the first weeks of the season?
With last season's numbers. In Weeks 1 to 3 there is almost no current data, and three games of averages will tell you a team is great or terrible when it is neither.
So start the season on last season's numbers. As games are played, blend in this season's averages and let them take over week by week, until by midseason you are running on this year's data alone.
Early season is hard for everyone, and the books are guessing too. A steady, boring method has less competition in September than it seems.
What does using it look like each week?
The routine the sheet is built for takes about five minutes. On Tuesday, once Monday night's game is done and the new lines are out:
- Paste the updated team stats into the Data tab.
- Type in this week's spreads and totals.
- Look at the flagged games only.
- Check the news on those games.
- Bet the ones that survive, record them, and close the laptop.
No refreshing odds on Sunday morning, and no talking yourself into a game the sheet did not flag.
How do you know if your model is any good?
Track every bet it flags: the line you took, the result, and the closing line. Win rate over one NFL season will not tell you much, because a season gives a simple model only a few dozen bets. Even a good method can lose over a stretch that short.
What tells you more, sooner, is whether you beat the closing line. If the line keeps moving toward your number after you bet, the model is finding real value. Closing Line Value Explained shows how to measure it.
For a sense of what a simple sheet can do when it is used with discipline: my own NFL model has gone 146-112 (56.59%) over the last five seasons. It works on the same principle as the one above: averages, a projected number, and a big-gap rule.
FAQ
Do I need to know how to code to build an NFL betting model?
No. Everything in this model is basic Google Sheets: averages, simple arithmetic, a lookup to pull in each team's numbers, and one built-in function for probability. If you can write =AVERAGE(), you can build it. Most people get a working version done in one evening. The hard part is not the formulas. It is sticking to the rule about when to bet, especially on a Sunday when every game looks like an opportunity.
Where can I get NFL stats for free?
Pro Football Reference and ESPN both publish team scoring stats for free, for the current season and for past seasons. Copy the team table from either site and paste it straight into your sheet. You do not need a paid data feed or an API for a model like this. Keep one tab for this season and one for last season, so the sheet has something to work with in September.
How much time does it take each week?
About five minutes once the sheet is built. You paste the new team stats, type in the week's lines, and the sheet recalculates every game at once. Then you read the flags and check the news on those games only. Building the sheet the first time takes longer, usually an evening, but you only do that once.
Can a simple spreadsheet model beat the sportsbooks?
It can on the games where the line is clearly off, which is why it only flags big gaps. It will not beat the market on every game, and it does not need to. Its job is to give you a number of your own, keep you out of games where you have no edge, and show you over time, through closing line value, whether the edge you think you have is real.
Why does my model disagree with the line by 10 points?
Usually because the model is missing something the market already knows. A starting quarterback ruled out, a star receiver injured or a storm in the forecast can move a line by several points, and a sheet built on season averages sees none of it. Treat a huge gap as a question before you treat it as a bet. Check the news first. If nothing explains it, then it deserves a closer look.
Should I use the model for spreads or totals?
Both. The same projected score gives you a spread and a total, so every game produces two comparisons from one calculation. Treat them as separate bets, each with its own big-gap rule. A game can be a pass on the spread and flagged on the total, or the other way around. Record them separately too, so you can see later which one your model handles better.
If you would rather start from a finished sheet than build your own, my NFL model and the others are on the models page. If you want to see how a line turns into a probability by playing with the numbers yourself, the interactive tools do exactly that.
Where to start if you have never built a model
The sheet above is the NFL version of something you can build for any sport. If you want to be walked through your first one, from a blank spreadsheet to a number of your own, that is what The Ultimate Modern Bettor's Toolkit is for.
$27, one payment. It includes the +EV betting model spreadsheet, a 45-minute video training that builds your first model with you, and the four-bucket staking system. 30-day money-back guarantee.
MB built Underdog Chance around one idea: make your own number first, then bet only when the price beats it. Over the last 20+ years his simple, probability-based Google Sheets models have helped thousands of bettors stop following picks and start pricing bets for themselves.
Last updated: 25 September 2026