NHL Betting Model
200 wins. 205 losses.
Up 30.76 units.
Two tracked seasons.
A losing win-loss record and a profitable result at the same time.
That isn't a typo.
It is the clearest example I can give you of why betting is about price, not simply picking winners.
Across those 405 tracked bets, the average odds were +109 (2.09).
At decimal odds of 2.09, the breakeven win rate is about 47.85%.
The actual tracked win rate was 49.38%.
You don't have to win more than half your bets when you're being paid enough when you're right.
The NHL Model is a Google Sheet that projects goals, win probabilities, fair odds and totals for the games on the slate.
Select the teams and goalies, load the data and compare your number with the sportsbook price.
405 tracked bets · 49.38% win rate · average odds +109 · +30.76u
One-time payment · Lifetime access · 30-day money-back guarantee
Your number vs. the market
One goalie can change the price.
The model gives you projected goals for each team, a projected total and a win probability.
Change the goalie and the projection changes with it.
That matters in hockey because the starting goalie can materially change what a game should be priced at.
Instead of starting with:
“Who do I think wins?”
you start with:
“What price does my model give this game?”
Then you compare it with the sportsbook.
The demo
Look inside before you buy.
This isn't a sales video. I open the real NHL sheet and walk through how it works so you can see what you're buying before you pay.
Why I trust this version
I broke my NHL model.
It took me six years to fix it.
NHL was one of my strongest markets for years.
Hockey and baseball also have something important in common for a model builder: the starting goalie and starting pitcher can move the number significantly, and both sports give you enough underlying data to build around.
Then the NHL model stopped working well enough for me.
From 2018 I rebuilt it and failed.
Then I rebuilt it again.
I began seeing meaningful improvements around 2022 and 2023, and by the 2024/25 season I finally had a version I trusted enough to bet seriously and sell.
The results on this page belong to that version and the season that followed it.
I'm not mixing older versions into the record just to make the history longer.
Six years is how long I was willing to keep something off the market rather than sell a version I didn't trust.
This is the version I use.

This is the version I use.
Marjan Balasko · Underdog Chance
Betting since 1998 · Building models since the early 2000s
The goalie problem
The sharpest input often arrives late.
Starting goalies are sometimes confirmed close to puck drop.
If you're in North America, you may be happy waiting for confirmation and updating your numbers.
I bet NHL from Europe.
Many games start at 1 or 2 in the morning, and I'm not staying awake every night waiting for a lineup tweet.
So I built the workflow to work both ways.
You can use the confirmed goalie when you have it.
Or you can run the model earlier using the team-based inputs and come back only to the games where the potential value is large enough to justify another look.
You choose game by game.
I don't chase late news for a game where the model is already showing no meaningful discrepancy.
Inside the sheet
What you get for every game.
Projected goals
The model estimates goals for each team using the team, situational, goalie and player inputs in the sheet.
Win probability + fair odds
The projected probability can be translated into decimal or American fair odds so you have a price of your own.
Projected total
The model produces the total it expects for the game.
Value number
Enter the sportsbook price and the sheet shows how far the market is from your number. I normally start paying attention around a value reading of 1.5, but you can set your own threshold.
Adjusted Kelly stake
The model also produces a stake recommendation tied to the size of the edge. My practical staking cap is 2 units. Even if the calculated recommendation is higher, I do not risk more than 2 units on a play.
Player impact
Player-level inputs allow injuries and lineup changes to move the team projection rather than treating every lineup as identical.
The settings
Nothing is locked.
Most finished models give you one number.
This one also lets you control how the inputs are weighted.
You can change the balance between:
- all-strength offense
- 5-on-5 offense
- power play
- all-strength defense
- 5-on-5 defense
- penalty kill
- recent form
- full-season form
- current-season player statistics
- previous-season player statistics
Each weighting block has to add up to 1.
The calculation framework stays intact.
You're changing what the model emphasizes, not rewriting the formulas.
If you think recent form should matter more than I do, increase it.
Now the disagreement happens in numbers rather than opinions.
The work
3 minutes and 55 seconds.
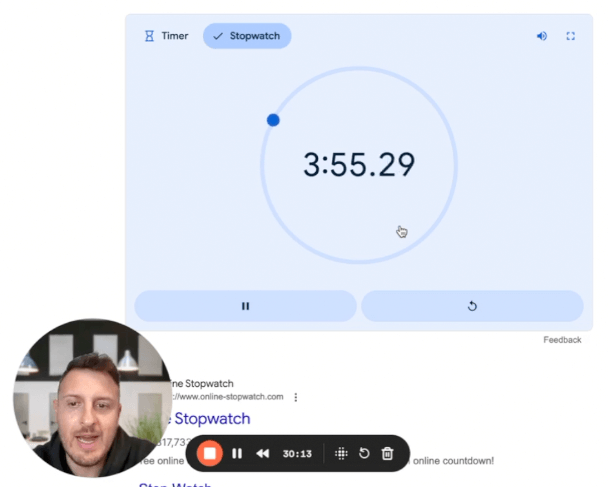
That stopwatch is the copy-and-paste portion of the daily workflow.
The routine
- 1Paste the day's statistics
- 2Check lineups on the games that deserve a closer look
- 3Select teams and goalies
- 4Enter the sportsbook odds
- 5Read the projected prices, value numbers and suggested stakes
The data paste itself takes under four minutes.
For a full slate, including looking at relevant lineups and games, budget around 15 to 20 minutes.
There is an IMPORTHTML route if you're comfortable in Google Sheets, but the source site has blocked automated scraping at times.
Copy and paste isn't elegant.
It is reliable.
And four minutes is four minutes.
No coding.
No formulas to write.
Nothing to install.
The routine
Decide the rules before the bad week.
Hockey gives you a lot of bets.
That gives a real edge more opportunities to show up, but it also gives variance a lot of opportunities to test you.
Before the season, decide what you're trying to achieve, how much you're prepared to lose and what would make you stop and reassess.
Then run the process.
Do not invent a new staking system in the middle of a losing week.
Tracked results
Two seasons.
Both of them.
| Season | Record | Win % | Units |
|---|---|---|---|
| 2024/25 | 117–114 | 50.65% | +32.27u |
| 2025/26 | 83–91 | 47.70% | −1.51u |
| Total | 200–205 | 49.38% | +30.76u |
A losing record.
A profitable result.
That is not a contradiction.
Across the two tracked seasons the average bet was priced around +109 / 2.09.
At 2.09, breakeven is approximately 47.85%.
The tracked win rate was 49.38%.
Price determines how often you need to win.
Not every profitable bettor has to finish above .500.
Both seasons stay in the table at the same size.
2024/25 was strong.
2025/26 lost 1.51 units.
A record that only shows the good season is not a record.
Past performance does not guarantee future results.
The honest scoreboard
Did the price beat the close?
Wins and losses tell you what happened.
Closing line value helps tell you whether the price you took was good.
I track two versions.
CLV is the normal comparison between the price taken and Pinnacle's closing price.
I also track xCLV, my vig-free version, where Pinnacle's closing margin is removed before the comparison.
That is the stricter number.
For the highest-conviction plays, where the model's adjusted Kelly recommendation reached the 2-unit tier:
| Season | CLV | xCLV |
|---|---|---|
| 2024/25 | +4.05% | +1.44% |
| 2025/26 | +2.87% | −0.05% |
The 2024/25 2-unit plays beat the vig-free Pinnacle close by 1.44%.
The following season was effectively flat by the same strict measure at −0.05%.
I am showing both.
CLV does not guarantee profit.
But it gives me another way to judge whether the prices I took were actually better than the market's final prices.
This screenshot shows part of the tracking workflow and a limited date range. It is not presented as proof of every figure above. The table above contains the tracked season-level figures supplied by me.
Last season
The most expensive lesson I can hand you.
Part of the 2025/26 loss was my own doing.
On some entries I selected the wrong team and then bet the value number that mistake produced.
If I remove those bets afterwards, the season looks better.
I'm not doing that.
A result you correct after the fact is not a real result.
“I would have won if not for...” is one of the oldest lines in betting.
What matters is the lesson.
This is still a manual model.
You select teams, goalies and prices.
If you enter the wrong thing, the spreadsheet can give you a very confident answer to the wrong question.
So check your inputs.
Especially when the apparent edge looks unusually large.
An unusually large edge is often a reason to check your work before it is a reason to increase your bet.
I paid for that lesson.
You don't have to.
Not a black box
You can check the work yourself.
A customer opened the NHL sheet and ran his own backtest.
He also documented the limitations of his own test, including the goalie data he couldn't reproduce historically.
That is exactly how I want this used.
Don't blindly trust the output.
Inspect it.
Test it.
Question it.
Build on it.
His backtest figure is his own independent test, not an official Underdog Chance performance result.
Read this before you buy
I would rather lose the sale than sell you the wrong thing.
Moneylines have been stronger than totals in my tracking.
Across the two tracked seasons, the moneyline side produced the stronger result. Totals went 58–57 and lost 1.96 units. That does not mean totals can never work. It means my own evidence tells me to be more selective there.
NHL is a difficult market.
There is a lot of public data and plenty of sophisticated bettors using it. The model gives you a structured independent number. It does not make you smarter than every professional in the market.
It does not give you picks.
It gives you projected prices and value numbers. You decide whether to bet.
It does not promise a winning season.
One of the two tracked seasons lost money. That will happen again.
It is a spreadsheet.
Google Sheets. The daily workflow is manual and works best on a laptop.
You have to actually use it.
The workload is small, but unlike NFL it repeats on most days you want to bet during the season.
This is for you if
- You already bet NHL and want a number of your own.
- You are willing to spend a few minutes on the workflow.
- You want to see and control the model's assumptions.
- You care about price rather than simply picking winners.
- You can live with a model having a losing season.
- You are comfortable working in Google Sheets.
Skip this if
- You want someone to send you picks.
- You expect guaranteed profits.
- You will not open a spreadsheet regularly.
- You need to win more than half your bets to feel that the process is working.
What you get
Everything you need to run the model.
The NHL Model
Google Sheets model with projected goals, probabilities, fair odds, totals, value calculations and adjusted Kelly staking.
Settings page
Control the model's weighting without rewriting its core calculations.
Instruction video
The walkthrough shows how to load the sheet, run a slate and read the output.
Written guide
The statistics and workflow explained, including how to carry the model into future seasons yourself.
American Odds Bet Tracker
Track wagers and closing-line value in American odds.
Decimal Odds Bet Tracker
The same tracking workflow for decimal odds.
Lifetime access
Pay once. No subscription. No annual renewal. Your resources remain inside My Library.
Getting-started email support
If you have trouble getting started, email mb@underdogchance.com.
Bonus
50 complimentary AI Assistant credits.
Use them to try the separate Underdog Chance AI Assistant on real games. Buying the NHL Model does not start an AI subscription. Nothing renews automatically. The credits are added manually after purchase.
NHL Model
$299
One-time payment.
No subscription.
Lifetime access.
- NHL Model
- Instruction video
- Written guide
- American Odds Bet Tracker
- Decimal Odds Bet Tracker
- 50 complimentary AI Assistant credits
30-day money-back guarantee
Buying more than one sport?
The All Models Bundle is $997 and includes the Toolkit, all seven core models and bonus content.
$1,920 if purchased individually.
See all models →After purchase
What happens after you pay.
Your purchase is connected automatically to the email address you use at checkout.
Open My Library and enter the same email.
We send you a magic link.
Your NHL Model, walkthrough, written guide and resources will be waiting there.
Make your own copy of the Google Sheet and start with the walkthrough.
Nothing to install.
No password to remember.
Open my library →Questions getting started? mb@underdogchance.com
30-day guarantee
Run the model yourself.
Use it.
Run some slates.
See whether the workflow and way of thinking fit how you want to bet.
If it isn't for you, email me within 30 days and I'll refund your purchase.
That's it.
In their words
You don't have to take my word for it.
Questions
Before you decide.
How does it work?+
You paste the day's statistics into the sheet, check the relevant lineups, select the teams and goalies and enter your sportsbook prices. The model produces projected goals, probabilities, fair odds, totals, value readings and suggested stakes.
Do I need to be good at math?+
No. The calculations are already built into the spreadsheet. You load the data, select the inputs and read the output.
How long does it take each day?+
The data paste itself took 3 minutes and 55 seconds when I timed it. For a full slate, including checking the relevant lineups and games, budget around 15 to 20 minutes.
Do I have to pay for data?+
No. The statistics used in the workflow are available free online.
Can the data be imported automatically?+
There is an IMPORTHTML option if you're comfortable in Google Sheets, but the source site has blocked automated scraping at times. Copy and paste is the reliable workflow and the one I recommend.
What if I cannot wait for goalie confirmations?+
You can run the model earlier using the team-based information and revisit only the games where a goalie change could materially affect an interesting price.
Is this a picks service?+
No. It produces your own prices and value readings. You decide whether the sportsbook price is worth taking.
I've bought picks before. What makes this different?+
A pick gives you someone else's conclusion. Here you have your own model, you can inspect the assumptions, change the weights and produce your own prices.
What does the value number mean?+
It represents how far the sportsbook price is from the model's own price. I normally begin paying attention around 1.5, but you can choose your own threshold.
Which sportsbook do I need?+
Any sportsbook whose prices you can compare with the model. Access to more than one book gives you more prices to shop.
Does it work outside the USA?+
Yes. I use the model from Europe myself.
Will it work next season?+
You keep the model and training. The written material explains how to update the inputs and use it in future seasons. This is not an annual subscription.
What is CLV?+
Closing line value compares the price you took with the market's closing price. I track conventional CLV and also xCLV, my vig-free version that removes the Pinnacle closing margin before comparison.
Why is the total record below .500?+
Because many of the bets were at prices above even money. Across the tracked sample the average odds were around +109 / 2.09. At those prices you do not need to win half your bets to be profitable.
Are these guaranteed picks?+
No. There are no guaranteed bets. This is a probability and pricing model, not a promise that an individual wager or season will win.
What are the 50 AI credits?+
Complimentary credits for the separate Underdog Chance AI Assistant. Buying the NHL Model does not start an AI subscription and nothing renews automatically.
Can I get all the models?+
Yes. The All Models Bundle is $997 and includes the Toolkit, all seven core models and bonus content.
What if I don't like it?+
Email me within 30 days and I'll refund your purchase.
I still have a question.+
Email mb@underdogchance.com.
Last thing
A losing record.
A winning bankroll.
200 wins.
205 losses.
+30.76 units.
If that combination still looks strange, that is exactly the gap this model is built to close.
Betting is not a contest to see who predicts the most winners.
It is a pricing problem.
The model gives you a price of your own so you can compare it with the market and decide whether you're being paid enough to take the risk.
A few minutes of work.
Then your numbers instead of somebody else's opinion.
One-time payment · Lifetime access · 30-day money-back guarantee